Final Project Documentation

My final project is a web-based online calculator.

屏幕快照 2016-01-25 上午3.55.01

I have been studying Calculus for years since middle school. Whenever I went to class I would have to carry the huge graphing calculator (Well, it’s not that big but it’s definitely huge compared to my cellphone). Therefore, I have been looking for a graphing calculator app that can run both on my laptop and my cellphone.

When I was thinking of the final project, this idea popped into my head: Why not create an online graphing calculator of my own? It does not have to include all the functions that an actual calculator has. I just need it to have the functions that are required on a calculus class.

Then I started working. The most basic function for a graphing calculator is obviously ‘graphing’. My idea is that since a screen only has finite resolutions, then the curve shown is essentially a collection of finite pixels. So I just need to correspond points on the actual curve into pixels with their coordinates on the canvas. Then I draw a line between any two consecutive points. The lines will sum up to be a curve.

The code implementing this:


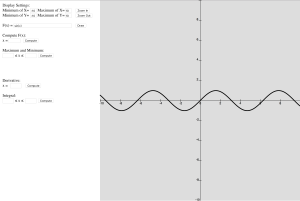
Then I move on to set up the coordinate system (for this version only cartesian system is available). In this part user can set the part of the curve that he/she wants to be displayed. It needs four parameters which are the maxima and minima of x-coordinate and y-coordinate to be shown on the canvas. Then I used two for-loops to display the line x=0 and y=0 and ten intervals on them.

The code implementing this:

Next thing to do is to allow users to type in functions to be drawn. In this part I used a javascript library called math.js. It has parse and compile functions which can parse and compile a string variable and evaluate its value.

With the main framework ready, the implementation of other functions became simple. To compute f(x) at a certain point just needed a function that returns the y-value. For derivatives I used the definition of derivative, I compute the slope of the line connecting two consecutive points. For maxima and minima I used the function in Javascript getMaxOfArray() and getMinOfArray(). And lastly for integral I used Riemann Integral which is to divide the range into 10000 intervals and calculate the sum of the area of the rectangles.

屏幕快照 2016-01-25 上午3.56.50

屏幕快照 2016-01-25 上午3.57.05

屏幕快照 2016-01-25 上午3.57.19

屏幕快照 2016-01-25 上午3.57.33

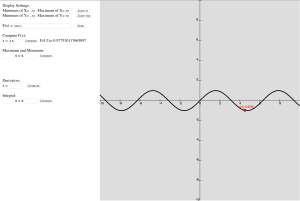
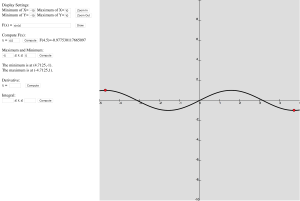
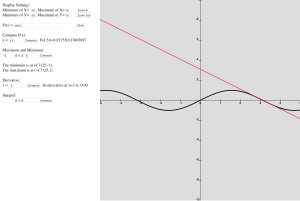
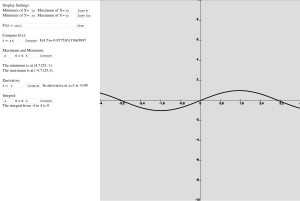
Lastly I added some interaction features. When the mouse is on the canvas there will be a point on the curve showing its coordinates and it follows the movement of the mouse. When computing values or maxima and minima the corresponding points will be marked as red. When computing derivatives the tangent line will be drawn on the canvas. My classmate Chirstos also offered a great suggestion regarding zooming functions, which were added by me yesterday.

animation

The code implementing this:

The complete program:

However there’s still lots of work to do. For example the function input part requires user to input exactly the expression for compilation. It would be better if I add buttons that control the input like the keys on the physical calculator. Also I may adjust the resolution of the page if it is loaded on a cellphone/tablet to enhance user’s experience. Also regarding the basic functions I can also add options for drawing parametric curves and multiple functions. There are many more options to explore. I find this website very inspiring: www.desmos.com.

Final Project Proposal

For the final project I plan to create an online graphing calculator.

The basic function is to draw the curve of the given function. I plan to create an array of points which store its own x-value, y-value, x-coordinate and y-coordinate. I need to use map() function to map its x-value to the x-coordinate. Then I just draw a point at each x and y coordinate. The points will form the curve of the function. So its draw() will be like this:

For the expression function I will use the Javascript math library which includes all the basic math functions. But the difficult part is how to convert user input into programming language. I will think about it later.

Since the curve is essentially an array of points. It can easily achieve some functions of a graphing calculator. I plan to add these several functions:

  1. Find the maxima and minima. The Math library itself includes min() and max() functions to find the minima and maxima among certain values. Then I find out there are functions that return the maxima and minima of an array: the getMaxOfArray() and getMinOfArray(). They seem to be the solution to my problem. I will read the reference and figure it out.
  2. Find the roots of a function. I will use Newton Method to find the roots. I’ll search for examples of its algorithm.
  3. Find its derivative at a point. I will use the definition of derivative. It is simply the slope of the line connecting two consecutive points.
  4. Find its integral over a range. I will use Riemann Integral. Its integral is the sum of areas of the rectangles between the curve and the line y=0.

Assignment #7

In this assignment I tried to create a project using vectors in p5.js.

The first idea that came in my mind was to create a basketball shooting game, since the track of the ball is a parabola which could be achieved by applying gravity of the ball.

So first I got started with creating a cannon that points to the direction of the mouse(I initially wanted to create a man shooting but I would have to draw it so I gave up). It was simple using rotating rectangles and circles. To ensure it points to the mouse I used some trigonometry tricks.

Then the physics part came in. I create a construction function for the balls. It has position, velocity and acceleration vectors and functions show() and move(). The details are quite similar with what we did in class. I tried to add a bounce() function but the it has some bugs: the ball wouldn’t stop and it randomly moves up and down instead. So I decided to delete the bounce() function.

Then a mouseClicked function is needed to shoot the ball. By clicking the mouse the ball is given an initial velocity whose direction is the same as the one of the cannon.

A gravity force is also needed. It simply increase the acceleration of the ball by a certain degree. And I also created the basketball net using lines and rectangles.

The last thing to do is to add a check function which aims to check whether it is a goal. My criteria is that if the ball is inside the position of the rim and it is going downward then it is a goal. It works for most of the times but is not 100% precise. I don’t know how to improve it yet.

Lastly I added some user interface with buttons and sliders and I ended up with this:

BASKETBALL GAME

Assignment #6

In this assignment I try to add some data visualization into my project. I decided to use the Spotify web api.

First I googled “Spotify JSON api” and got myself into the Spotify developer website. They have a tutorial for api which is for html and I basically had no idea what it is about. Then I went to the reference page and found queries that were very similar to what we looked at in the class. And I tried to go to the urls and successfully got the JSON data.

Then I followed the codes of New York Times offered by Professor Shiffman and managed to create a page like this:

If you type in a name and press search, it will search it in the Spotify artists database and open the page of the first result. The Spotify web api also provides a variety of usages. I’ll dive into it later.

Also recently we visited two design studios: Second Story and Rockwell Group. Both of them make very fascinating works in interactive designs. Second Story mainly focuses on display designs whereas Rockwell is an architect company.

One thing that surprises me about the designing process is that the designers are both artists and programmers themselves. The creative technologists handle both the art work and the coding process. I initially expected they have different positions with different jobs but it turned out that the employees are all versatile.

The project I like most the display in Second Story with the transparent LED display. It was the first time I saw a transparent display screen and I believe that it would be the mainstream technology applied on smartphones and computers in the future.


Assignment #5

I’m keeping working on my existing random painting. Today I tried to add something related to image into it.

I adopted the idea similar to pointillism. I want create random moving shapes whose color is that of the image at their positions. The first part of code I need to add is the preload function that loads the image.

Then in the Ball() function that controls the ball. I need to change the parameter of the fill() function that set the color of the shape. Thus I added a variable c = img.get() to get the color of the image at the certain position. And then change the fill() function.

Next I needed to change the size of the canvas to accommodate the whole image. Fortunately I have already modulated the width and height of the canvas so I only need to change it to image.width and image.height.

So I can create pictures like this:

屏幕快照 2016-01-13 上午10.45.48

屏幕快照 2016-01-13 上午10.47.11

Homework 4

In this homework I try to add some interaction into my previous object. I want to use some sliders to control the speed, diameter, and transparency of the random moving balls.

I tried to use functions of sliders in the library p5.dom.js. So I need first to go to the index.html in the web editor and uncommented the lines involving the p5.dom library.

First I created three variables of sliders that are used to set speed, diameter and alpha of the balls. Then I used the function createSlider(), slider.position() and slider.value() to define these sliders.

But now I encounter a problem displaying the values of the sliders. Since I want to show the traces of the moving balls so I could not use the background function to reset the canvas. But I have to reset the part where the values are shown. I came up with a solution using fill() and rect(). I just draw a rectangle over the area that I want to reset with the background color. In every frame that part of the canvas is equivalent to be reset.

Then I move on to create buttons to control the movement. I intended to create two buttons: stop button and continue button. The stop button simply stops the movement. So the stop function is just noLoop(). Similarly the continue function is just loop().

So I ended up with this:


The Museum Journey

I have been to two museums in the past few days. This blog is to document my experiences in the museums.

Last Friday I went to the American Museum of Math with my class. In my understanding museum is a place where one can “see” all the exhibits and thus one can only experience the exhibits visually. So I had expected the museum to exploit only geometry and topology, which are the parts of math that can be visualized.

As I had expected, most of the displays are related to geometry. But what I hadn’t expected was that much more interactivity was added into the exhibits. For example, on the first floor, one can experience the magic of catenary hisself by riding on a trike with square wheel. The human tree is also an extraordinary example. They used sensors to let viewer to experience the fractals. There also were things other than geometry like the exhibit of binomial probabilities.

This museum did much more than a traditional museum in that it did not only visualize math but also add interactivity in it as well, which most of the museums cannot achieve.

If I were to add some exhibits I would definitely choose to add a display of space-filling curves. It is amazing to see how 1-dimensional curves like Peano Curve and Hilbert Curve can fill a 2-dimensional plane. There are also some other interesting curves such as the Weierstrass which is continuous everywhere but nowhere differentiable.

Yesterday afternoon I went to the American Museum of Natural History with my class. Honestly I was a bit disappointed that there exist no moving dinosaurs and Roosevelt as shown in the film Night at the Museum. But my friend made a good point that I had to wait till the night.

In the Secret World Inside You exhibit I saw many fascinating interactive displays. I like the way they used only projectors and a few touch sensors to make the impression that the whole table is a touch screen. And also the game in which we could use a grip to control the virtual grip on the screen.

My favorite part of the museum is the planetarium show. It used a 180-degree screen to generate 3D effect. It is very exciting to get immersed in the show. Using a huge screen is one way to build Virtual Reality environment. If interactions were to be added in the planetarium, VR games like the ones of Oculus Rift could be a good idea.

If I were to add a section in the museum I would add an interactive exhibition of modern digital technology. Virtual reality and augmented reality were once people’s dreams but now they are coming true. I would want viewers not only to feel the past but also to imagine the future after their journey in this museum.

Keep Working

I wanted to keep working on my random ball movement with the new features learnt about Javascript, the objects and constructor functions.

I first tried to change my balls into literal objects. I feel like the objects in Javascript is very similar to the classes in Java, only without the constructor functions.

Luckily it was fairly easy since I already have all the codes modulated as a function so I just needed to copy&paste the codes and do some minor modifications.

Changing it to a constructor function is easy as well since the codes for an object share the same form with the ones of the constructor functions and I only needed to change the syntax.

But I decided to move further. I wanted to add more than just two random moving balls to my design. So I searched and learnt how to store objects in an array. It was not difficult as well since I already had experience in Java.

So I ended up with this:

The interesting thing about this is that if the speeds and diameters are changed it can generate very different patterns.

This is the default setting:

assignment#3

If the speed is changed to 20:

assignment#3(2)

Interesting things will also happen if you change the shape to squares and/or diameter to 1 or 2 and/or speed to more than 100.

assignment#3(4)

assignment#3(5)

Assignment#3(6)
 

Second Assignment

In my second assignment I try to create a random moving circle at a constant speed using things we have learnt in the previous lecture.

The first difficulty I met is to achieve randomness. I first wanted to use things like “xpos += random(-10,10)”. However, this statement lets the ball moves randomly within a range and thus failed to remain the constant speed. So I used the Pythagorean  theorem instead, since in the cartesian coordinates “(xspeed)^2 + (yspeed)^2 = (speed)^2”.

But a new problem came. In this sense xspeed and yspeed are both positive since I used the expression “yspeed =  sqrt(speed^2 – xspeed^2)”. But a in a random movement the circle should be able to go to any direction. So I introduced a new random variable xrandom ranging from -1 to 1. If xrandom is negative, the x coordinate decreases and if it is positive, x increases. Similar is the case of y coordinate. And with this method randomness is ensured.

However, after I finished this I realized using polar coordinates instead of cartesian coordinates is a better idea. As the angle θ ranges from -π to π, sinθ and cosθ range from -r to r. Thus there is no need to introduce a new variable to guarantee randomness.

Another problem is to constrain the circle inside the canvas. I didn’t know of the function constrain() so I used several if statements to achieve this. Then I merged these statements with the ones to ensure randomness.

Lastly I tried to extract the random moving circle as a function. I set the diameter and the speed of the circle as parameters. I may add some buttons or sliders to control the speed and diameters.

(Click any key to start the movement.)


First attempts

It has been a long time since I coded last time. It was about two years ago when I studied Java in high school. As a math major student, I consider it crucial to own some computer programming skills. I have always wanted to pick up my skills but have been too busy with other stuff to do so. I’m finally back to the world of programming and it feels extremely great.

For the first assignments I was just messing around with p5.js and trying to remember the things I had learnt about Java (since its grammar is very similar to the one of Javascript).

For the static image I drew a pattern with circles and squares only. As a math student I have always had an obsession with circles and squares since they are considered as the most “perfect” shapes of geometry. It makes even more perfection if they could cut each other. Thus I made an image with circles and squares cutting each other with the ratio of their radius either 1/2 or 1/√2.


Then I tried to use the functions fill(), stroke() and random () to add some random colors to my image. so the final pattern is like this:

(The colors are completely random so the colors will change each time you refresh the page.)

For the animated one I tried to use something that I’ve learnt in Java: the for-loop. Fortunately Javascript shares this grammatical feature with Java so I succeeded at the first attempt. I created some bizarre pattern like this:

Then I tried to use the argument mouseIsPressed and ended up with a drawing tool:

(Try to click your mouse inside the canvas.)

Then I also tried to make something else with p5.js. I tried to create a circle moving around inside the canvas toward a random direction with a constant speed:

This one is more complicated since I have to think about the conditions of the loops to ensure that the direction is random and the circle remains inside the canvas. (I didn’t know of the function constrain() until I saw the example of “nervous square” given by Professor Shiffman, so I used if() to achieve this. Also, letting it move at a constant speed requires some mathematical knowledge.)

These are just me messing around with p5.js. These example probably will have nothing to do with my final project. For the final project I want to devise a simple graphing calculator. I expect it to not only track the graph of a function but also do some calculation as well such as its maxima, minima, domain, range, or even derivatives and integrals. I will elaborate on this in my process of learning p5.js.